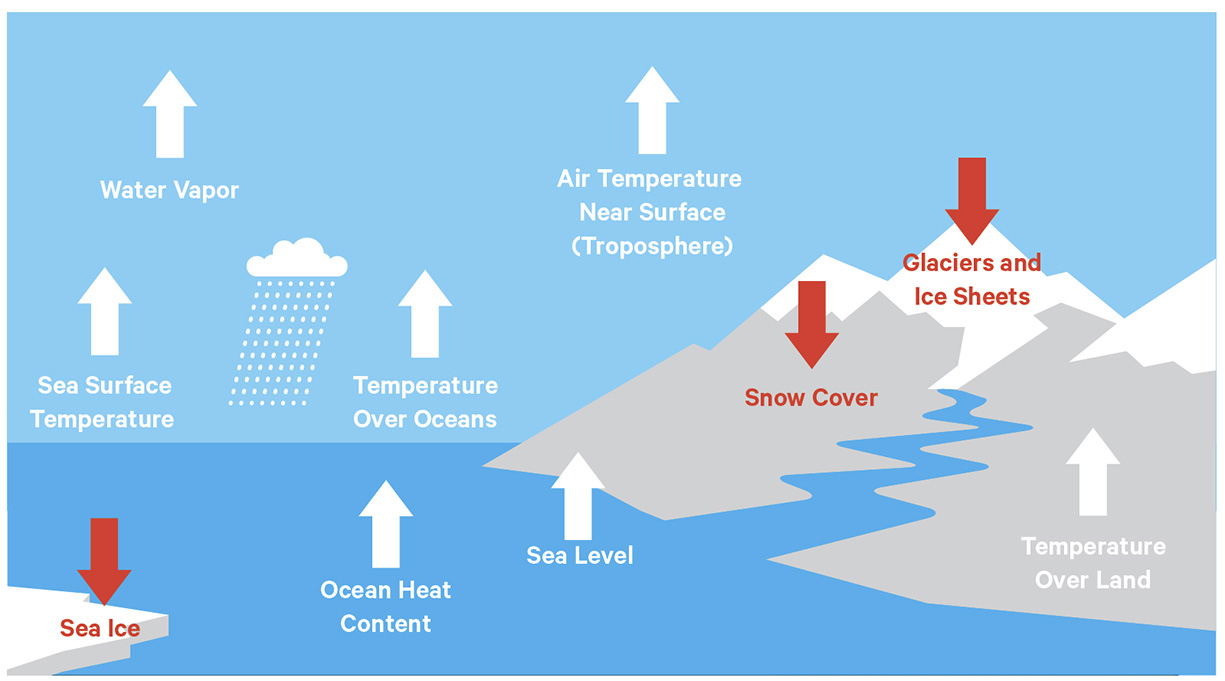
Climate change is the most urgent and pervasive of the threats our planet is facing. The warming it has been generating for decades can be seen in many different ways.
This chapter provides evidence of the rapid and dangerous changes humanity is already experiencing in face of escalating global warming, and the risks to which we will be increasingly exposed.
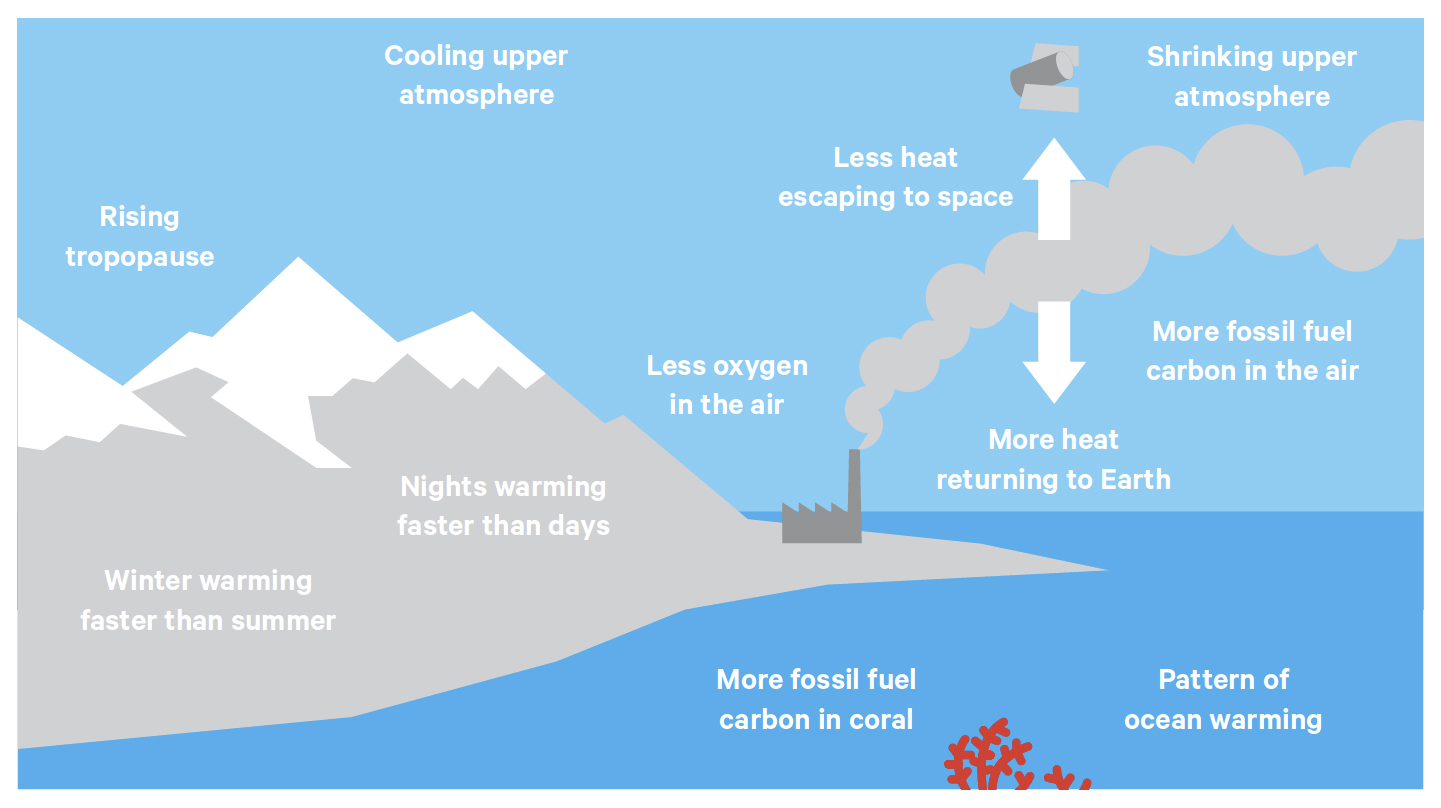
GRAPH 1: TEN INDICATORS OF A WARMING WORLD9
Increasing Global Temperatures
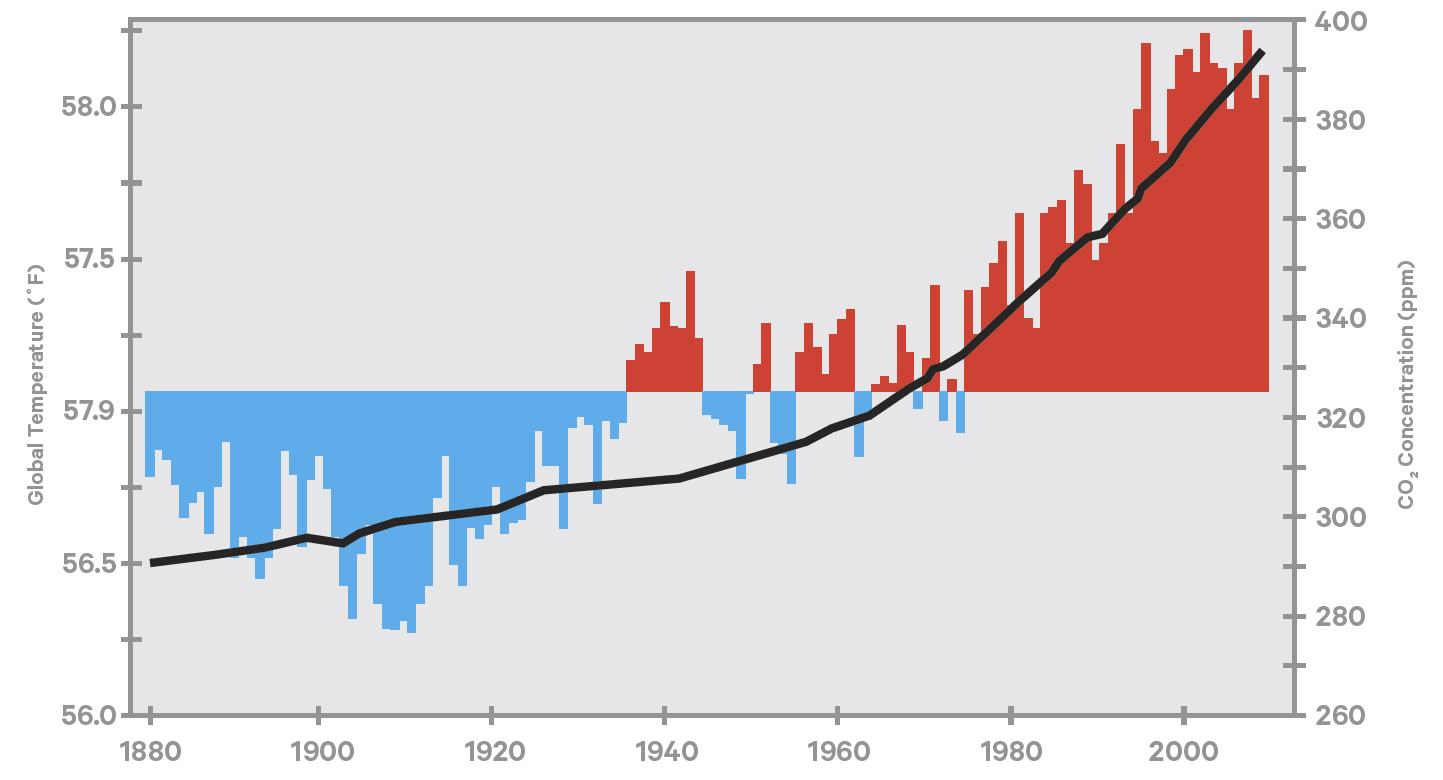
The increase in average atmospheric temperature has been dramatic in recent decades, as carbon dioxide levels have increased, as seen in graph 2. The list of warmest years on record is dominated by years from this millennium. Each of the 12 years between 2001 and 2012 were among the 14 warmest on record.
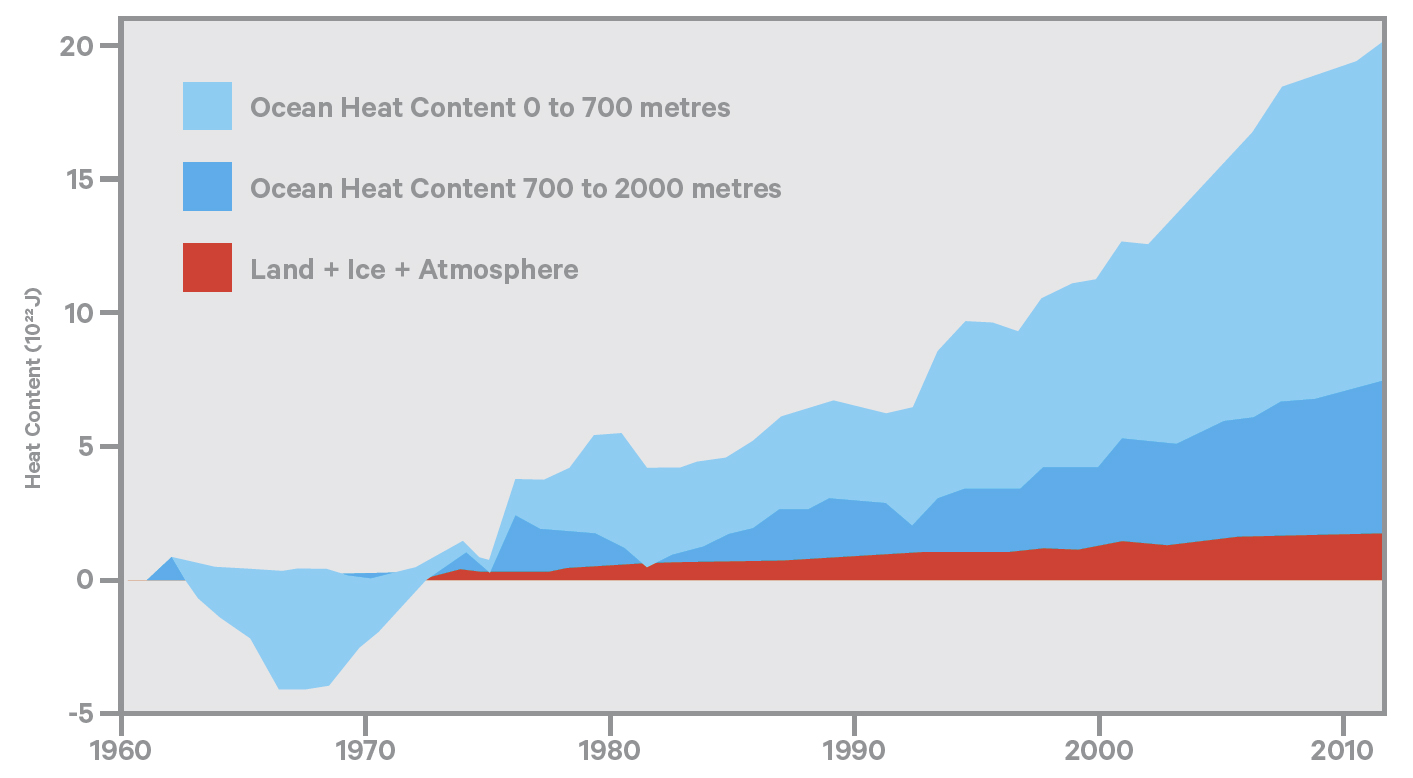
Some climate sceptics claim that the world has not warmed since the anomalously hot year of 1998, and hence the anthropogenic (man-made) global warming thesis can be discounted. is argument is not born out by the facts. Whilst the increase in average global surface temperatures has slowed, much as expected are a record hot year in 1998 and subsequent La Nina events, the heat content of the oceans, where most of the accumulating net energy is stored, has continued to increase rapidly.1
The 5th Assessment Report of the International Panel on Climate Change (IPCC AR5)4 estimates that around 90% of the increase in energy stored in the climate system in recent time has accumulated in the oceans.3
Increasing Frequency of Extreme Weather Events
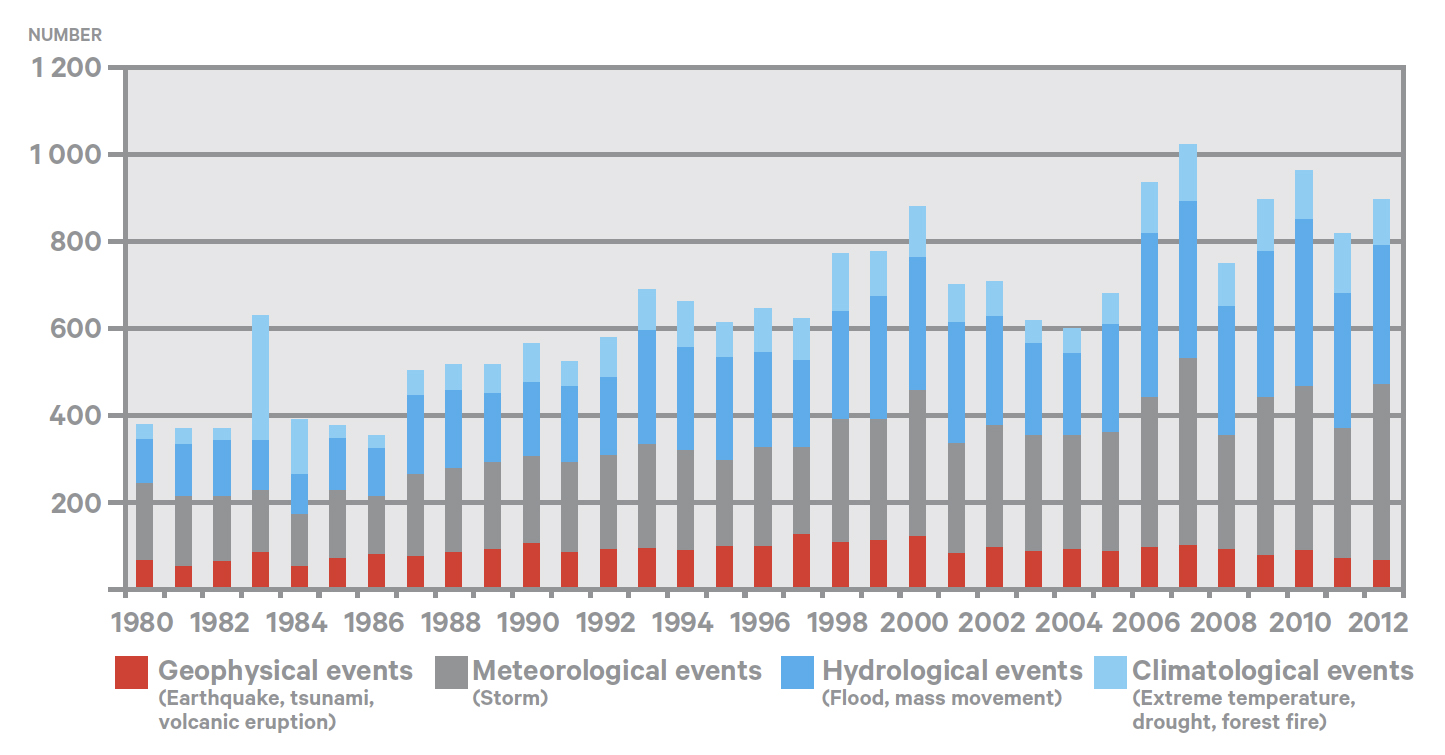
The occurrence of extreme weather events – events which are statistically outside the normal range of historical experience – is accelerating around the world as recent analysis by Munich Re, a major global insurance company, demonstrates in the graph below.
The question is frequently asked: “Is a particular extreme event caused by climate change”. The answer is that all events now have both a natural variability and a climate change component. The latter is due to the fact that the environment in which they occur is now warmer and more moist than it used to be. As warming increases, the climate change component will also increase.6
Are Humans the Cause of Global Warming?
Sceptics of the anthropogenic global warming thesis will often agree that the planet is warming, but attribute it to natural causes, arguing that such changes have occurred previously in geological history. They may also take the view that the degree of warming is of no great consequence and certainly not a reason to fundamentally change our lifestyles away from “business-as-usual”.
That view is not born out by the vast majority of informed science around the world, as the 5th Assessment Report of the Intergovernmental Panel on Climate change (IPCC AR5) makes clear:
“Warming of the climate system is unequivocal, and since the 1950’s, many of the observed changes are unprecedented over decades to millennia. It is extremely likely that human influence has been the dominant cause of the observed warming since the mid-20th Century“.7
This is further reinforced by the US National Climate Assessment (NCA) released in May 2014:
“Taken together, this evidence tells an unambiguous story: the planet is warming, and over the last half century, this warming has been driven primarily by human activity . The burning of coal, oil and gas, and the clearing of forests have increased the concentration of carbon dioxide in the atmosphere by more than 40% since the Industrial Revolution, and it has been known for almost two centuries that this carbon dioxide traps heat. Methane and nitrous oxide emissions from agriculture and other human activities add to the atmospheric burden of heat-trapping gases. Data shows that natural factors like the sun and volcanoes cannot have caused the warming over the past 50 years”.8
Scientists look for multiple lines of independent evidence to confirm human activity as the primary cause of global warming, some of which are indicated in this graph:
Each fingerprint is backed up by extensive scientific, peer-reviewed analysis which seek to contest or confirm the thesis.
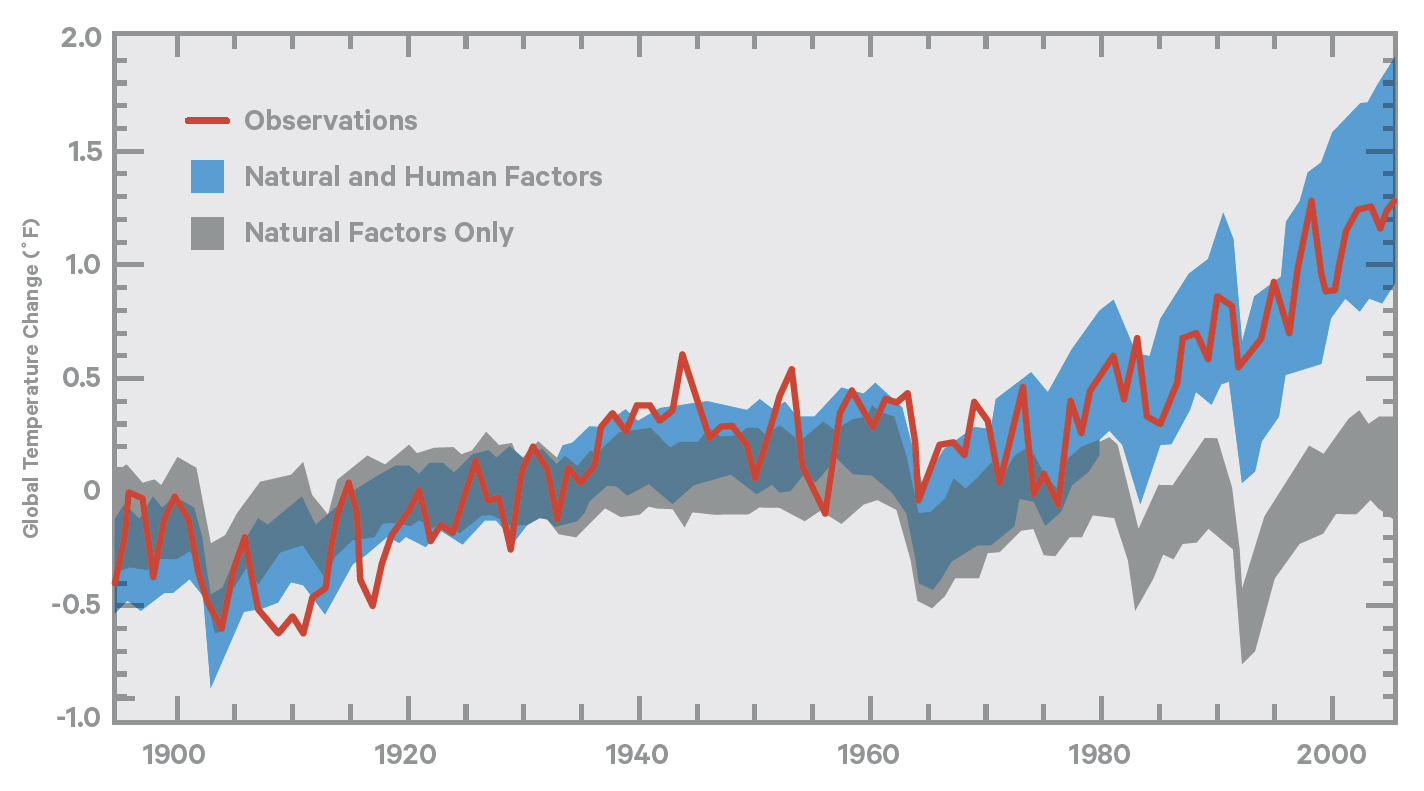
Further evidence, as shown in Graph 6, is provided by modelling analysis comparing actual observations of global temperature change with the change which would have occurred, first with natural forces alone, then with natural plus human forces (including the sun and volcanic activity). As the graph shows, the actual observed temperature changes over the last 50 years can only be explained by the inclusion of human forces.
The science on an issue this complex is never “settled” and knowledge will continue to improve, but informed opinion is clear – the planet is warming, and there is an extremely high probability that human activity, particularly the consumption of fossil fuels, is a large part of the cause.
Climate Change as Global Risk Management
Addressing climate change is essentially risk management at a global level. Despite uncertainties around the science, for some time we have known enough to understand that we face potentially catastrophic risks, risks that are with us now, not one or two decades hence. We ignore them at our peril – which is exactly what governments and corporations around the world are currently doing.
The basic science is well understood, and has been for decades. The uncertainties relate far more to the speed and extent of climate change impact. On that score, the newest empirical evidence demonstrates that we have badly underestimated both speed and extent.
The recent analyses of the Intergovernmental Panel on Climate Change (IPCC AR5) and the US National Climate Assessment (NCA) are understandably conservative, and do not include many of the more serious risks, such as rapid sea level rise from accelerating Arctic and Antarctic ice sheet melt and abrupt methane release from melting permafrost, as we currently have insufficient information to be definitive on their impact. However, given their potentially catastrophic nature, sensible risk management dictates that we must use the available information now to take precautionary action.
This is particularly so given the lag between emitting greenhouse gases and their impact being manifested. Such impacts may be irreversible, so by the time scientific knowledge has improved, it may be too late to prevent catastrophic outcomes. Indeed, in these circumstances where uncertainty is high and the possible impact is severe, there is a strong case for taking even greater precautions than if we had better knowledge.
Climate change is an unprecedented risk management challenge, for the survival of much of humanity is at stake. It requires catastrophic risk management techniques far different to those to which business and government are accustomed, whether in commercial operations, financial markets or even high-risk ventures such as deepwater oil exploration.
“Politically realistic” incremental change from “business-as-usual”, which epitomizes current policy, is no longer tenable. This must be replaced with normative policy where the targets required to avoid catastrophic consequences are defined based on the latest science. Action is then determined by the imperative to achieve the target, not by art-of- the-possible, incremental change. This will involve both mitigation – avoiding the unmanageable, and adaptation – managing what is now unavoidable.
Some examples of the risks of the global emergency we are facing are explained below.
Paleoclimate Analysis and Sea Level Rise
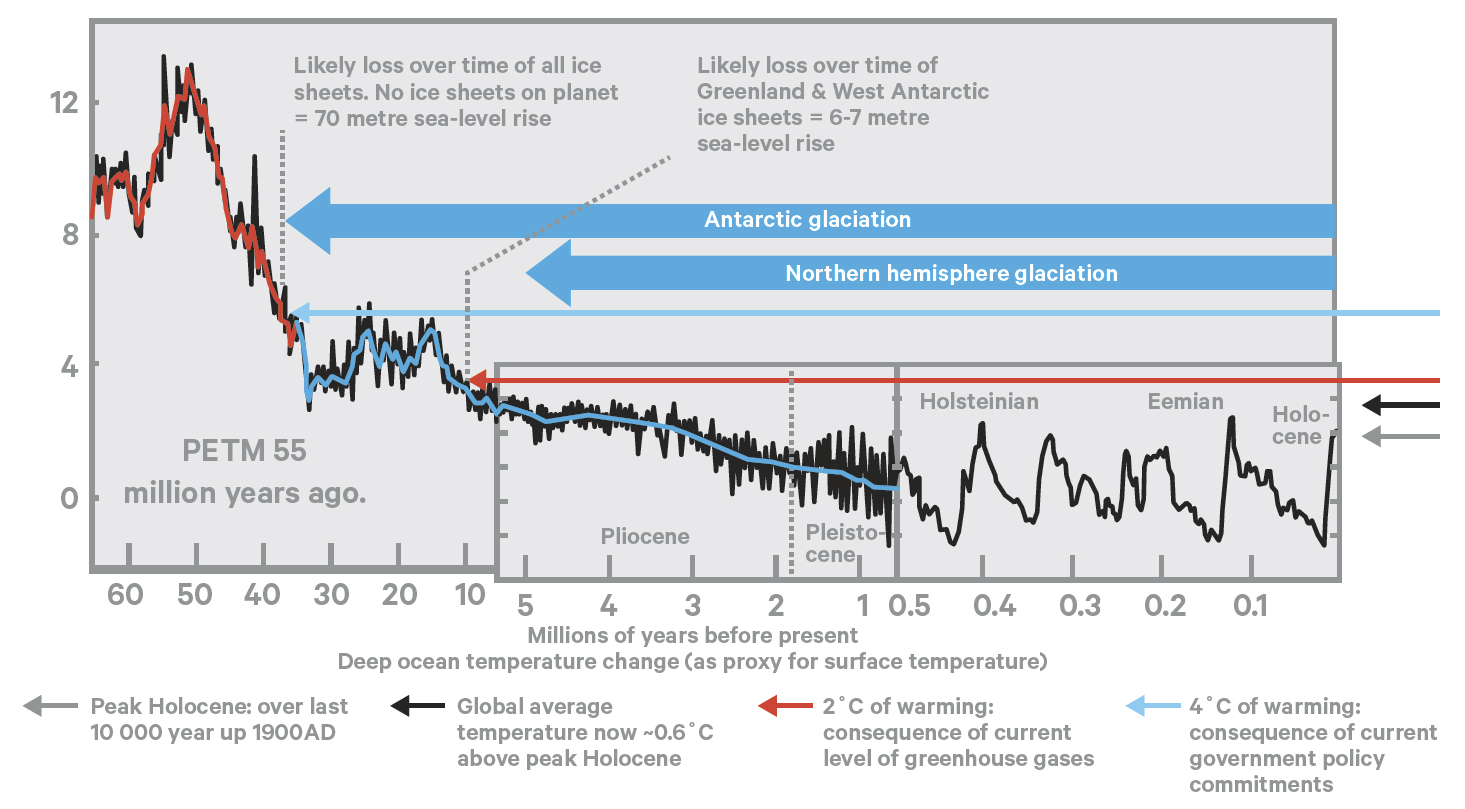
Recent advances in science and climate observations provide a better understanding of the ancient history of our planet’s climate. Some of the results are summarized in graph 7.
An explanation is as follows:
The graph 7 shows global average temperature over the last 65 million years, commencing from left with a peak at the Paleocene Eocene Thermal Maximum (PETM) 55 million years ago when there was no ice on the planet, subsequently cooling (blue lines) toward the present day at your right.
• As the planet cooled from the PETM, Antarctic glaciation began 37 million years ago, followed by Arctic glaciation 4.7 million years ago.
• Humanity as we know it only developed over the last 10,000 years to 1900AD, during the so-called Holocene geological era (at the extreme right of the graph). During this period, temperature was relatively stable.
• Global average temperature today is about 0.6° C above the peak Holocene temperature (black line).
• The objective of current negotiations is to prevent temperatures rising more than 2° C above pre-industrial levels (red line). is would take global temperature back to a point prior to the beginning of Arctic glaciation when – as you can see in the graph 7 – sea level rise was 6-7 metres higher than today.
• Current policies to address climate change agreed by governments around the world are far from achieving this objective. They are likely to result in temperature increase of around 4° C above peak Holocene (light blue line). is would take global temperature back to a point prior to the beginning of Antarctic glaciation when sea level was some 70 metres higher than today.
The facts in graph 7 are rarely discussed in the public domain or in current negotiations, maybe as the implications are too stark. If any of us were diagnosed with early stages of cancer most would take immediate and drastic action. Mankind, by contrast, is behaving quite differently and unfortunately moving in the wrong direction. Science has informed us now for some decades about these stark facts but only minimal action has been taken and, for the most part, negative trends have just intensified.
Therefore, the “official” objective, of limiting warming to 2° C above pre-industrial levels, is likely to produce 6–7 meters sea level rise over time, wiping out cities like London, New York, Shanghai, Singapore, Tokyo and Helsinki in their current form. If rapid world-wide action is not taken to limit CO2 emissions in the next few years, sea level rise of this or higher magnitude may well become irreversible – we could not stop it any more even if we belatedly develop the political will to start an emergency action some decades from now.
But current policies of governments all over the world, if implemented without change, are likely to result in temperature increase above 4° C and produce sea level rise of 70 metres over time, with catastrophic impact on humanity, given the large proportion of the global population living in low-lying areas in close proximity to coastlines.
This is not just a concern for small island states and low-lying countries like Bangladesh. Large swathes of China, Europe and the USA would be affected by even a 6–7 metres sea level rise let alone any higher figures.
Speed of Sea Level Rise
The speed with which the polar regions are warming heightens concern over the potential for more rapid sea level rise than acknowledged officially. The Arctic and Antarctic contain both floating sea ice, and ice sheets on land. e sea ice, as it melts, does not contribute greatly to sea level rise other than a minor amount as a result of thermal expansion, albeit its reduction is an important indicator of the speed of warming. The land-based ice sheets will be the major source of sea level rise.
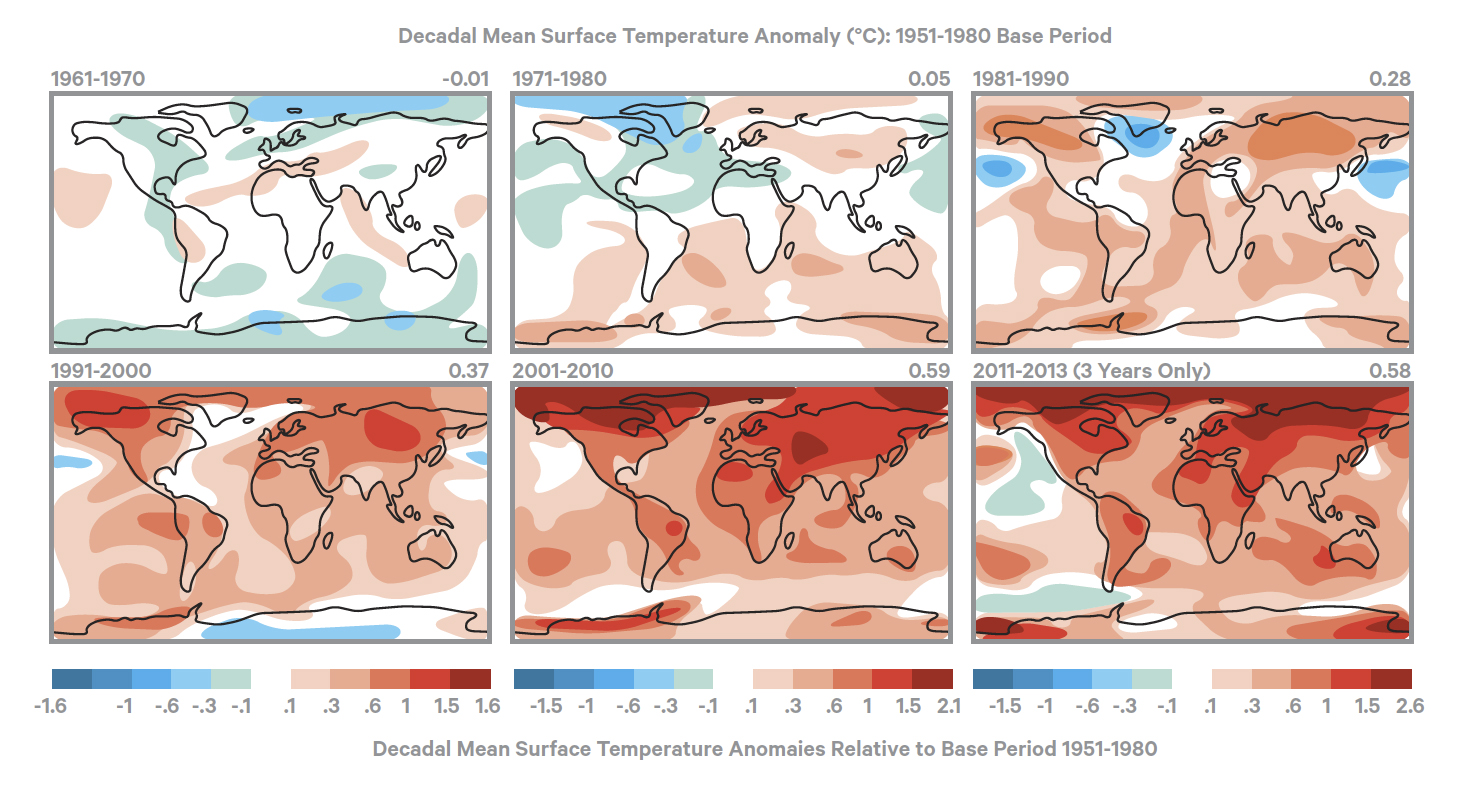
Graph 8 shows decadal average temperature increases over the last 5 decades and the first few years of this decade. The rapid warming at both poles, evidenced by the darker colours on the graph – 2-3 times the global average – should be of great concern to all of us.
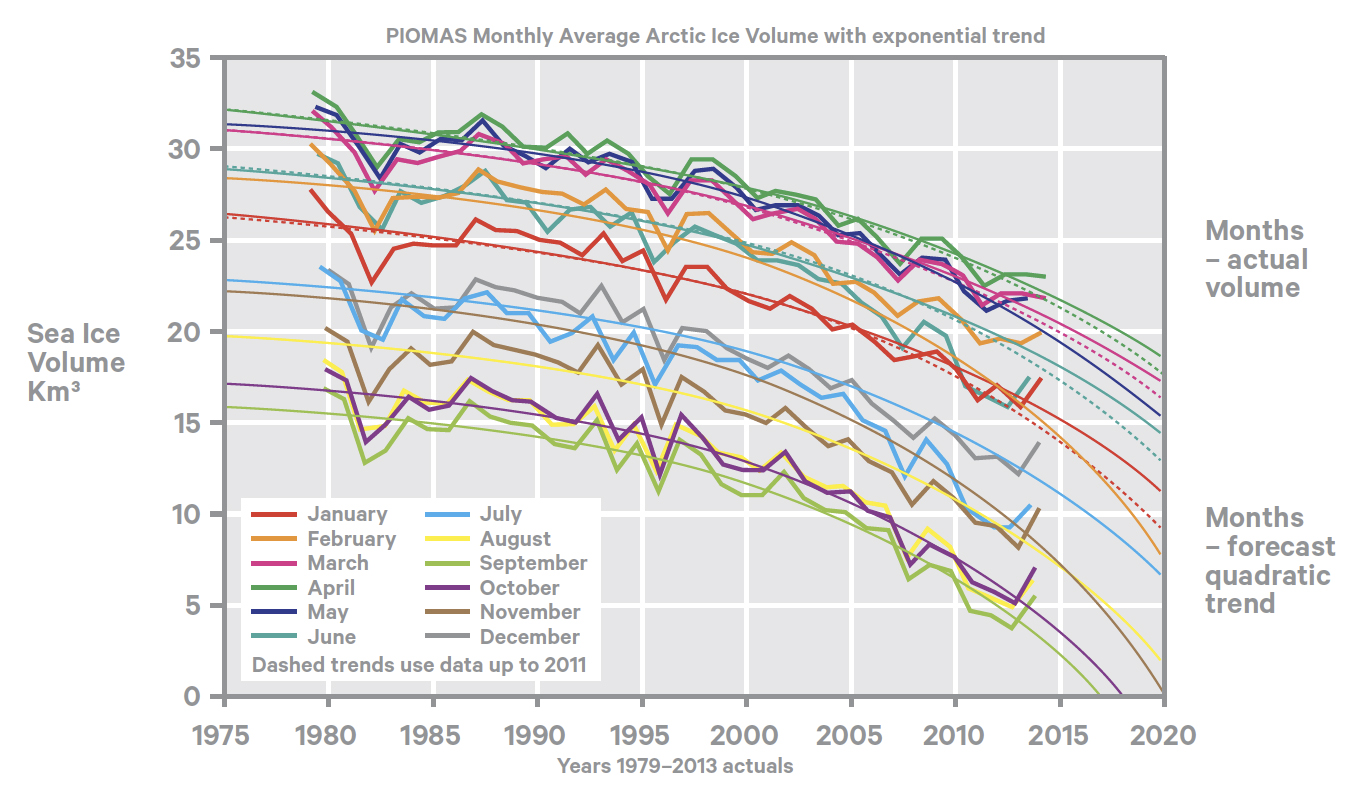
The result of this warming in the Arctic can be seen in Graph 9, which gives the actual sea ice volumes by month since 1979, with trend lines fitted to the data. It shows that, on present trends the Arctic might be sea-ice free in summer by 2015 -18, something that was not previously predicted to occur until late in the 21st Century.
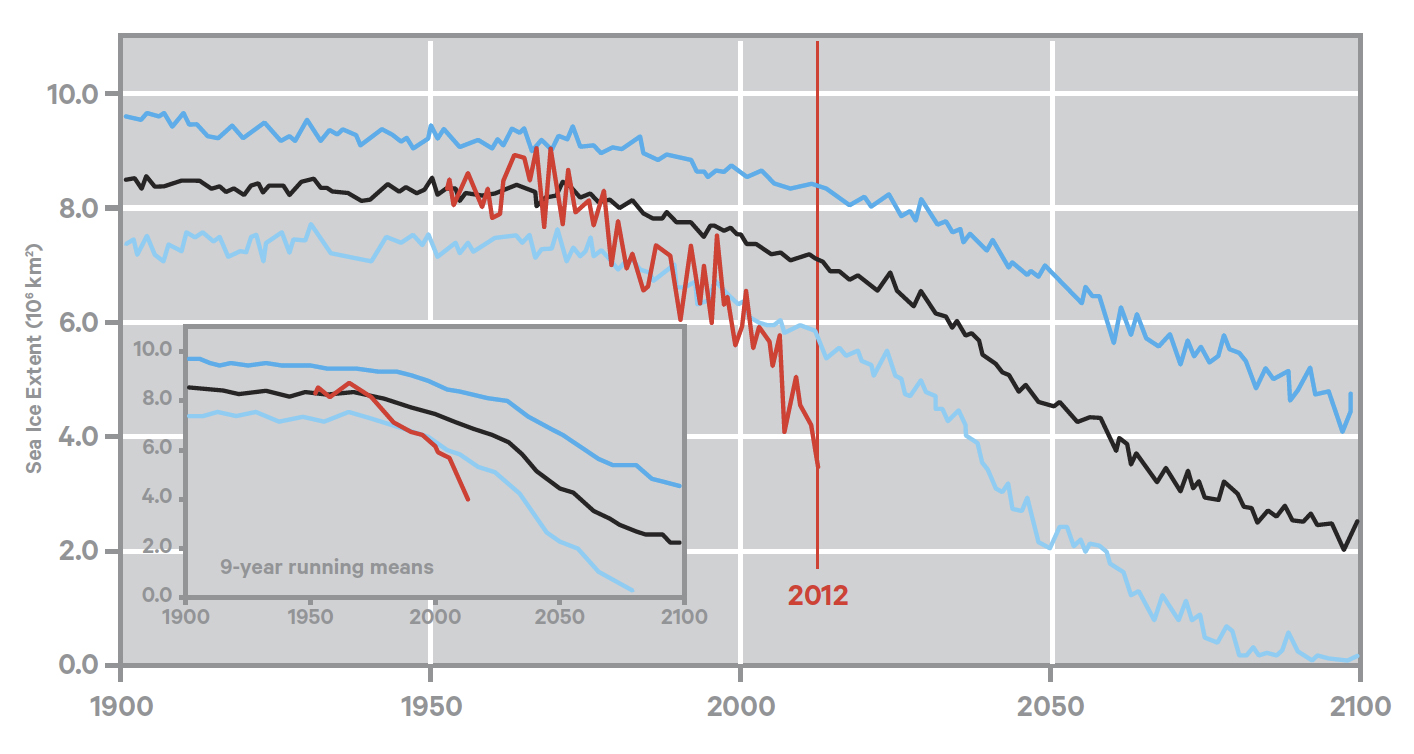
As the graph 9 shows, the annual minimum Arctic sea ice volume, which occurs in September each year, has reduced by 80% since 1979 and 40% in the last 7 years. This rate of melt is far faster than predicted by the IPCC in their Assessment Reports, as can be seen in Graph 10, which compares the areal extent, that is the area as opposed to the volume, of Arctic sea ice in September each year since 1900.
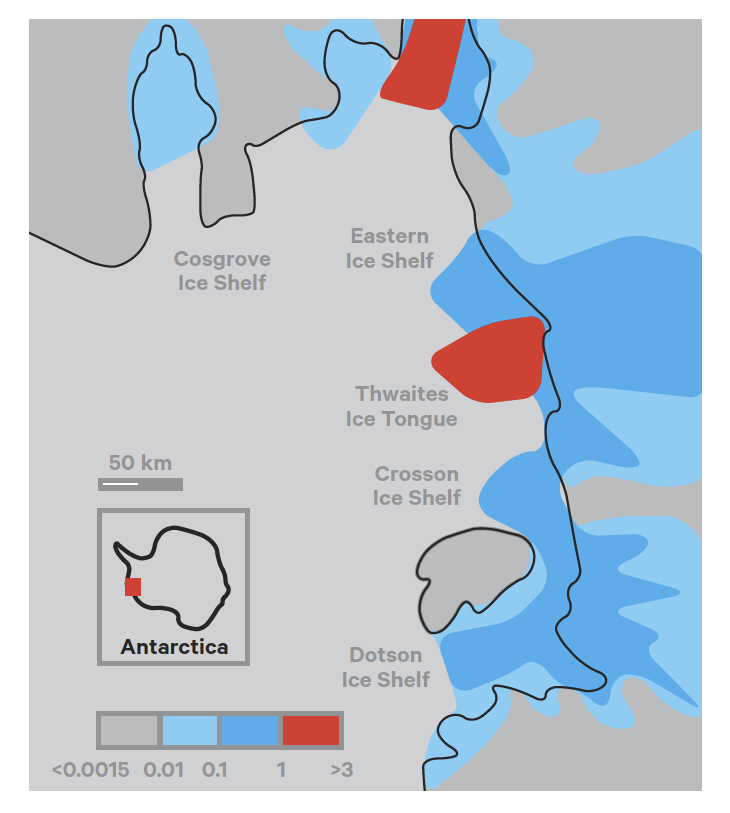
At the opposite pole, West Antarctica is warming twice as much as previously thought, almost faster than anywhere else on the planet. Warmer waters in the Southern Ocean now appear to be undercutting the ice sheets, which rest on rock at the sea water interface, pushing back the grounding line and leading to disintegration of the glaciers, as shown below.
The official view of sea level rise, for example from the IPCC and the US National Climate Assessment (NCA), is that the upper bound might be around 1-2 metres by 2100, with most opinion focused just over 1 metre.
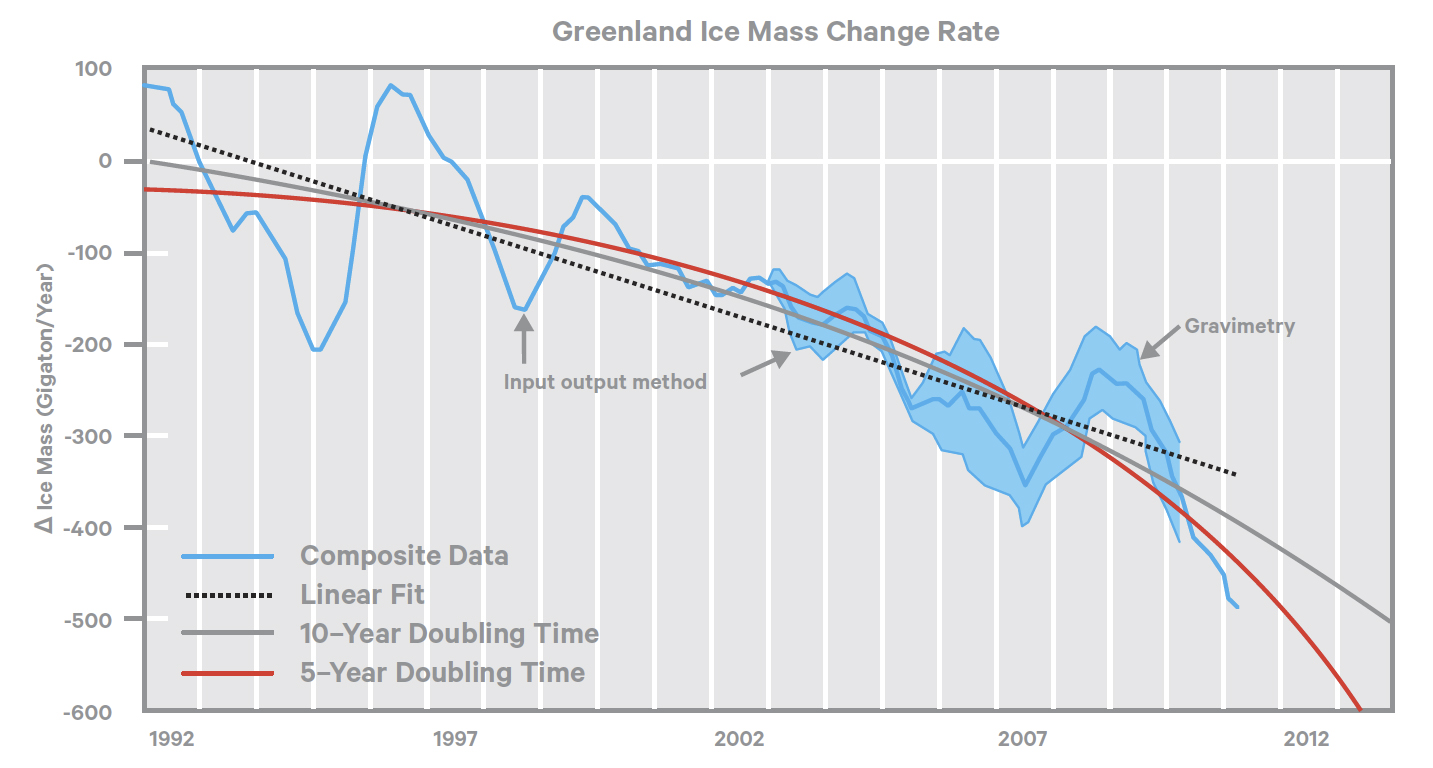
However, Dr. James Hansen, the prominent US climate scientist, former long-time Director of NASA’s Goddard Center for Space Studies and now at Columbia University’s Earth Center, in analyzing latest evidence of the Greenland Ice Sheet mass loss, has raised the possibility that melt rates are increasingly exponential, which would result in far more rapid sea level rise than previously expected. There is, as yet, insufficient data over a long enough period to confirm this view, but if current trends continue, depending on the doubling time, they would result in considerably faster sea level rise than being assumed officially. For example, as shown in graph 12:
• 10 year doubling time (gray line) would lead to 1 meter sea level rise by 2067 and 5 meters by 2090
• 5 year doubling time (red line) would lead to 1 meter sea level rise by 2045 and 5 meters by 2057 – this 5 meters sea level rise is only some 40 years ahead of us in this worst case scenario!
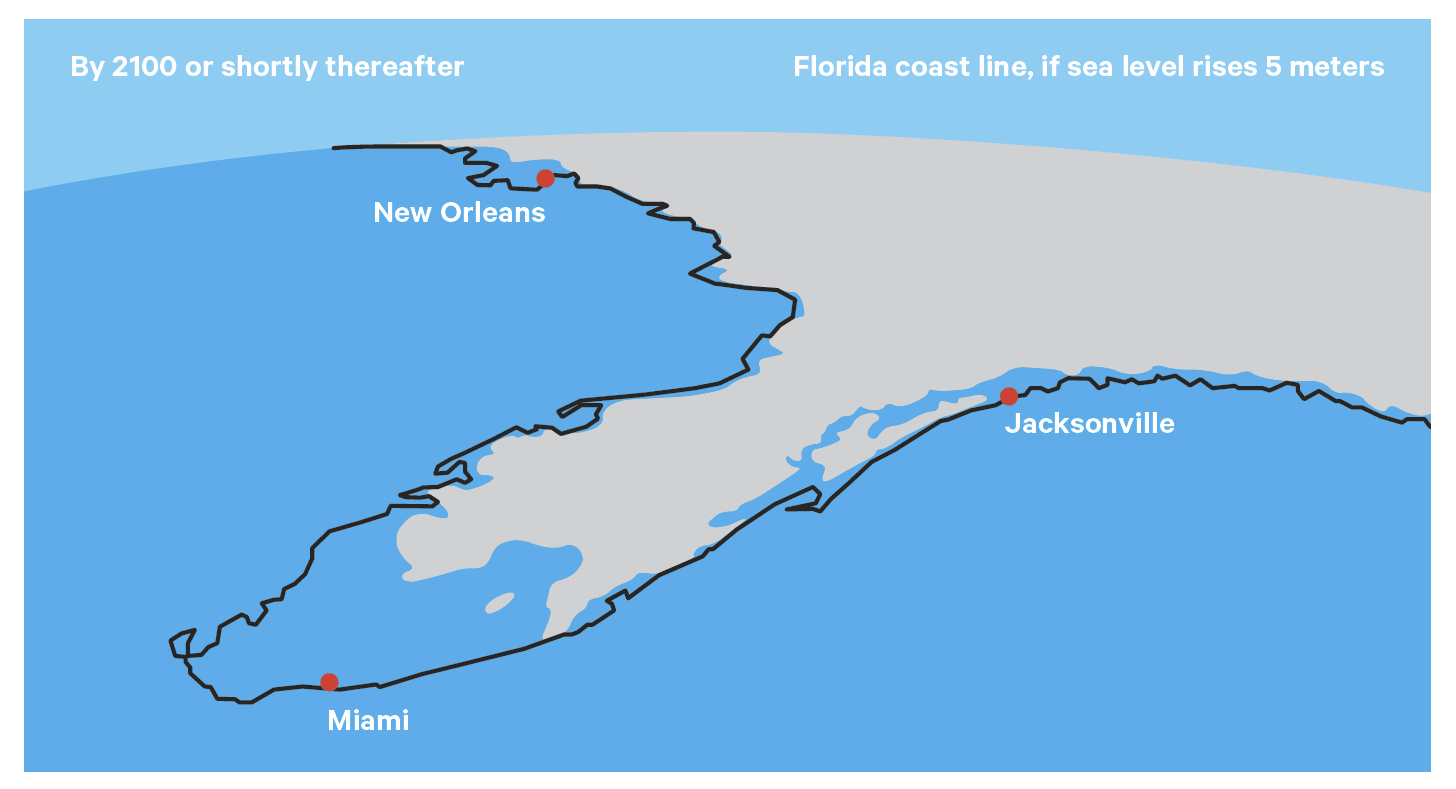
A 5 meters sea level increase early in the second half of the 21st Century is a fundamentally different prospect to anything being contemplated officially, and will have devastating consequences unless its risks are carefully managed. It highlights the increasing concerns, which have developed over recent years over the concept of tipping points as ice has been melting considerably quicker than earlier predicted.
An example of our future – if nothing fundamental is done in a matter of a few years before critical tipping points are crossed – is shown in picture 1:
Tipping Points
It is often assumed that the impact of climate change will manifest itself in a predictable, gradual manner as global temperature increases. Unfortunately this is unlikely to be the case due to the “tipping point” phenomenon. A tipping point occurs when the global, or regional, climate jumps rapidly from one relatively stable state to another which may be far less conducive to human development, or indeed survival. The jump would typically occur because of positive feedbacks in the climate system, where one small change triggers a far bigger change in the system overall.
The Arctic sea ice melt is a classic example. As accelerating warming in the Arctic melts the ice, its so called “albedo effect”, whereby the white ice reflects much of the incoming solar radiation back into space, diminishes. The surface area changes from reflective white ice to grey/green sea which absorbs more radiation, thereby speeding up warming. In turn the warmer water accelerates ice melt, as can be seen in the graphs above.
It also has other impacts. The Arctic contains extensive areas of permafrost, holding overall twice as much carbon as the global atmosphere. Accelerating Arctic warming also melts the permafrost, releasing further carbon into the atmosphere, much in the form of methane, which in the short term has a far greater warming impact than carbon dioxide, – eighty times stronger over a 20-year timeframe – further compounding the positive feedback.
A major concern with tipping points is that they become irreversible – once triggered, they cannot be stopped even if human carbon emissions were to reduce dramatically. This is particularly the case with Arctic warming as the evidence suggests we may already be close to, or possibly past, some tipping points of that massive geographical area.
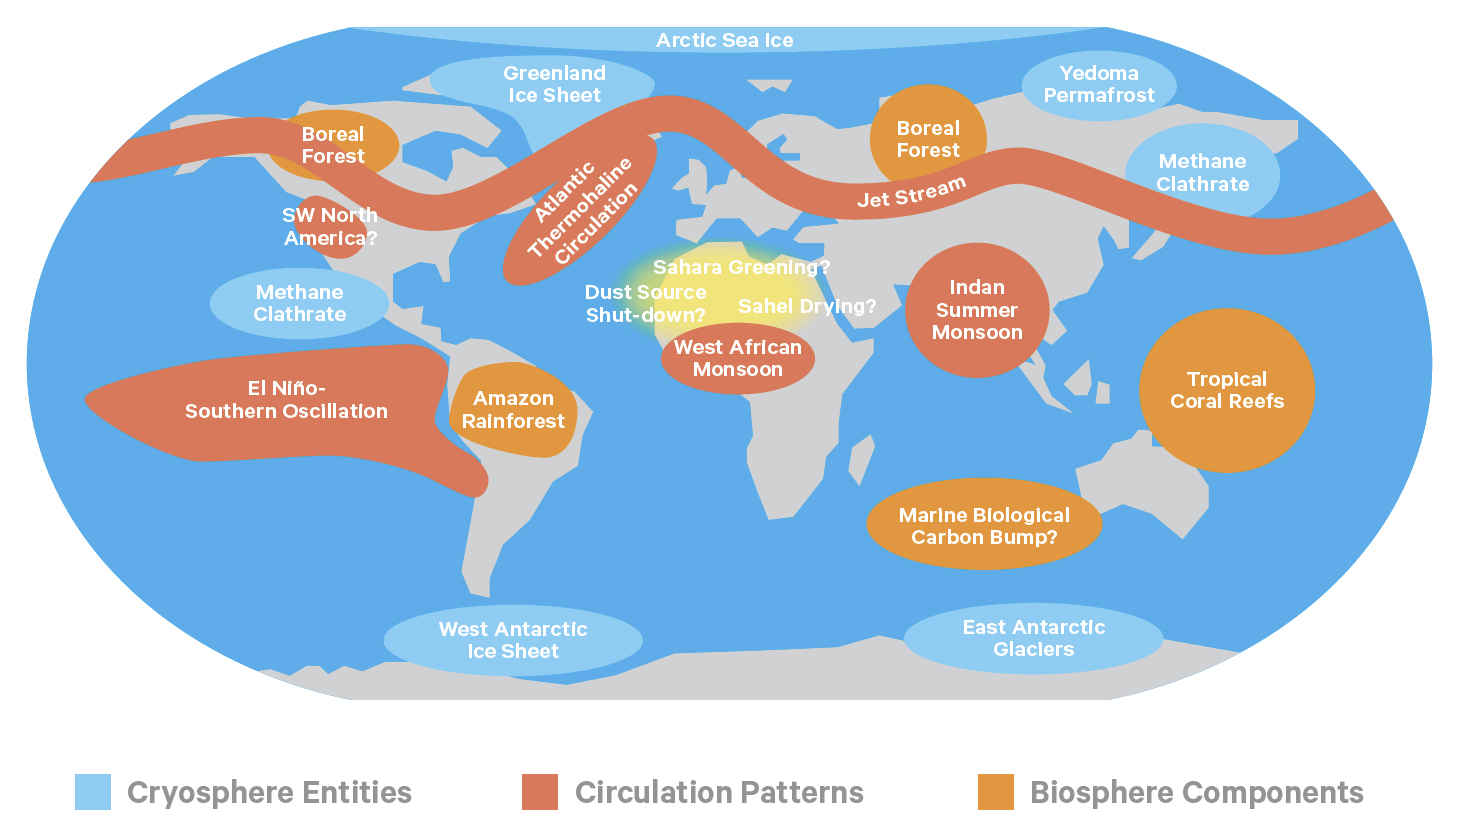
Major potential tipping points in the global climate system are shown in graph 13.
The Arctic sea ice and permafrost tipping point has been explained above. Other examples are as follows:
• Permafrost Methane Outburst: in addition to gradual release of methane to atmosphere with permafrost melt, there might also be a risk of a large abrupt release of methane – an outburst – at some level of temperature increase.
• Greenland Ice Sheet Melt: acceleration will create major sea level rise, as indicated above.
• West Antarctic Ice Sheet Melt: this would also have a major impact on sea level rise as discussed before.
• Amazon Rainforest: if recent droughts continue, dieback of the rainforest may result in the Amazon changing permanently from a major carbon sink, absorbing carbon and therefore reducing its amount in the atmosphere, to a carbon source, emitting carbon to the atmosphere. is would be a major reversal of the role of the Amazon in the global climate system, taking into account the huge land area it occupies.
• Indian Monsoon: a collapse of the monsoon could result in further drying of already drought-devastated areas, adding to existing social and economic disasters in major countries in the area, and possibly triggering wider climatic change.
• Ocean Acidification: accelerating acidification of world oceans as a result of CO2 absorption from atmosphere, is already having an extremely damaging eect on marine life, and thus on the food chain.
As climate change knowledge improves, scientists are still researching how each of these tipping points might be triggered, when, and what kind of cumulative impact they will have on our global climate. Some indication of current thinking on their ranking is given in graph 14. Whilst this can only be a preliminary assessment, it is essential that the possibility of such occurrences should be incorporated into our risk management of climate change. At the moment such incorporation does not take place and IPCC assessment reports have not quantified the impact of tipping points, due to lack of sufficient scientific knowledge.
GRAPH 14: TIPPING POINT IMPACT AND LIKELIHOOD17
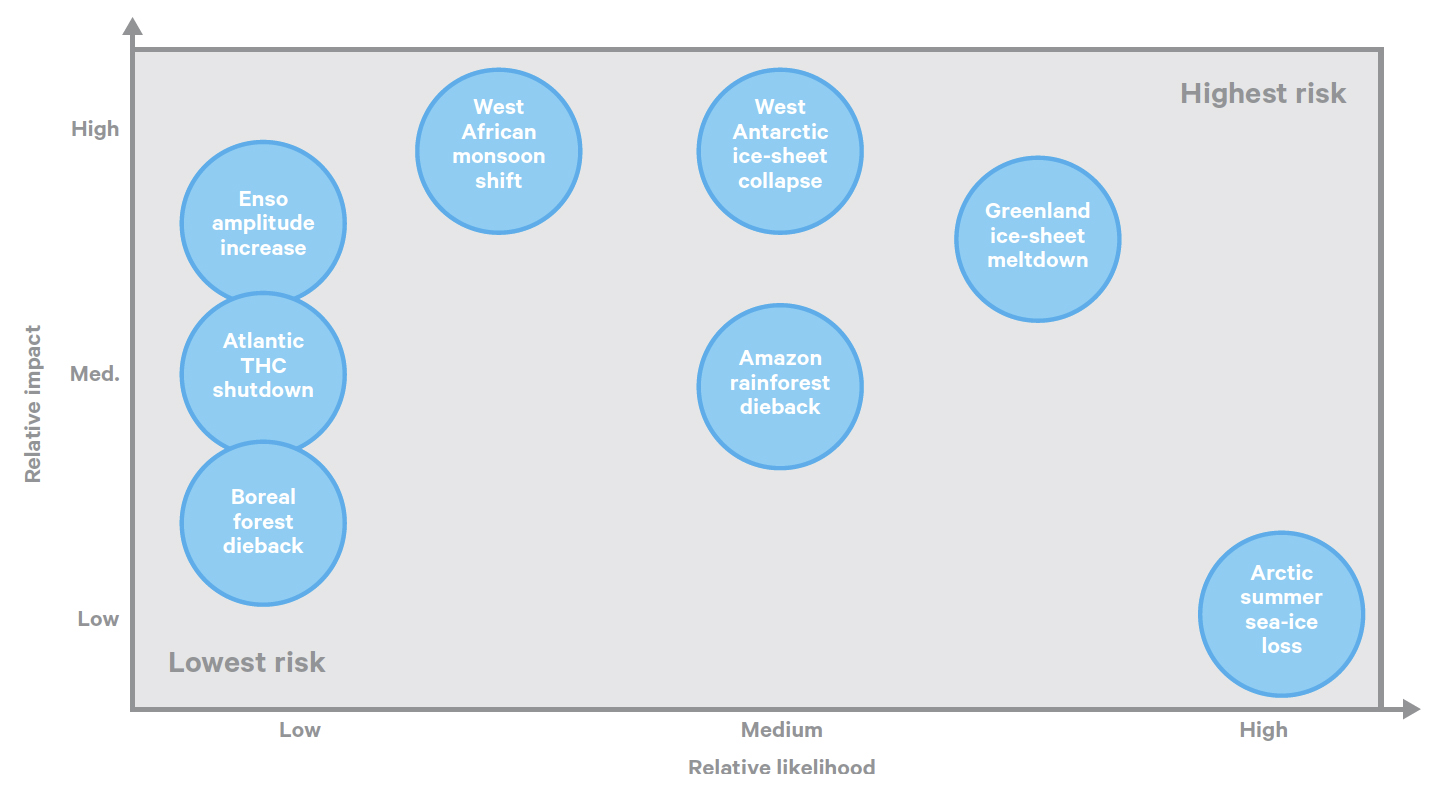
Note: ENSO is the El Nino Southern Oscillation in the Pacific Ocean.
Note: Atlantic THC is the Atlantic Thermohaline Conveyor which warms the European Continent.
Why Are Mainstream Sea Level Rise Projections Much Less Alarming?
The projections of IPCC have so far projected much smaller sea water rise towards the end of this century – only some 1 – 2 meters – and the public and decision-makers still expect these figures to be close to reality. But we have given much higher estimates in this publication. What could be reasons for this discrepancy? The reasons could be found in a couple of areas:
1. As discussed the cumulative impact of tipping points is not included at all or not to sufficient de- gree in IPCC projections (as it is scientifically difficult to estimate this very complex phenomenon).
2. The insights of the paleoclimate analysis has not yet been included, or not to a sufficient degree, in IPCC projections.
3. Common denominator approach in making IPCC projections might err on the side of cautious estimates; governments’ involvement might also have an impact tempering down the conclusions.
4. The long time period between publications of IPCC projections (6-7 years) and careful and time consuming checking of data might mean that projections are already dated when they come out.
A novelty of the issues of tipping points and paleoclimate analysis for scientists, politicians and public at large might be a major reason as well. Not much of their dynamics – how tipping points interact with each other and other events and trends in a shorter time or in a very long time period – is known for sure as it is a highly complicated scientific area. IPCC is a very conservative institution as it is a scientific body with governmental input and it prefers to err on the side of caution and mainstream views. But because any misreading or delay in understanding the potential and accelerating role of tipping points could be catastrophic for the future of humankind this discussion should be started among politicians and public at large as scientific certainty might never be reached in this complicated field – or only when it is too late to do anything meaningful any more.
A 4°C World – One Billion People Or Less – A World to Be Avoided at All Cost
As already mentioned, international climate change negotiations agreed some time ago that an acceptable target to avoid dangerous climate change as per the Charter of the UN Framework Convention on Climate Change (UNFCCC Charter) would be to limit global average temperature increase to no more than 2°C relative to pre-industrial conditions. There was no scientific validity to this target, rather it was thought to be “politically realistic”, as well as being roughly aligned to the scientific view at that time (10-20 years ago) of what constituted “dangerous”. However, as the analysis above indicates, current knowledge suggests that 2oC is far too high given the speed with which climate change is already occurring. Indeed, 2°C now represents the boundary between dangerous and extremely dangerous climate change.
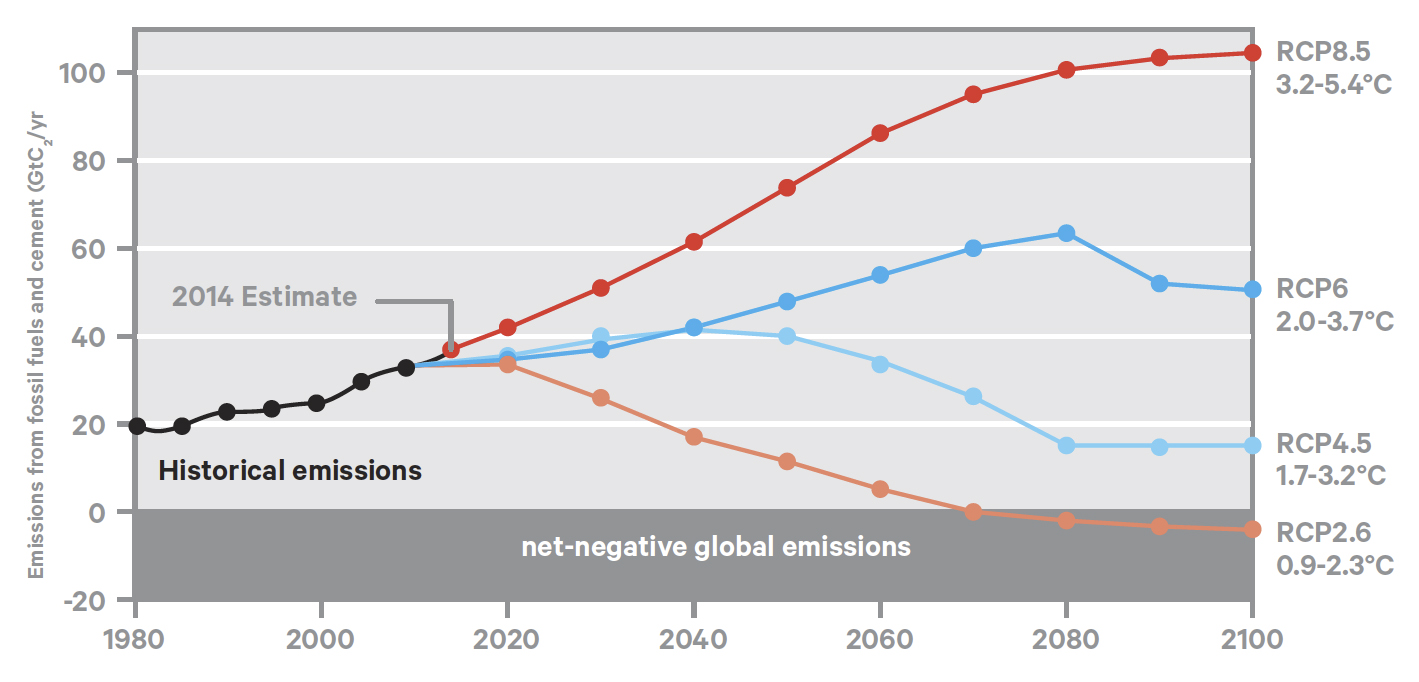
Despite international agreement and the mounting evidence, over the last two decades negotiators have been unable to agree on the means of achieving even the 2°C target. On the contrary, global emissions of greenhouse gases continue to accelerate above the IPCC’s worst-case scenario, as graph 15 indicates. The coloured lines show the IPCC Representative Concentration Pathways (RCPs), which are scenarios of various pathways of emission reduction. The upper red line is more-or- less business-as-usual. The lower orange line is the pathway to stay below the 2°C target. The other lines are intermediate emission scenarios. The black dotted line shows actual emissions to date, continuing on the worst-case business-as-usual pathway.
If nothing continues to be done to change the current global emissions trajectory, the world is heading toward a 3.2 – 5.4°C temperature increase this century, say on average 4°C, rather than the official 2°C objective.
Given the lack of global action, it is now almost inevitable that temperature cannot be constrained below 2°C. Rather than face up to the urgent need for change, political and business leaders glibly talk about adapting to a 4°C world with little idea of what it really means – which is a world of 1 billion people or less, not the present 7 billion as scientists have estimated a major drop in the carrying capacity of the planet to feed and nurture humans at these high temperatures.19
As the UK Royal Society put it January 2011, “In such a 4°C world, the limits for human adaptation are likely to be exceeded in many parts of the world, while the limits for adaptation for natural systems would largely be exceeded throughout the world”.20
When asked at the Melbourne 4 Degree Conference in July 2011 to explain the difference between a 2°C and a 4°C world, Hans Joachim Schellnhuber, Angela Merkel’s climate change advisor and Director of the Potsdam Institute for Climate Impact Research replied simply: ”human civilization”.21
Kevin Anderson, Deputy Director of the UK Tyndall Centre for Climate Change Research summarizes the dilemma as follows:
“For humanity it’s a matter of life or death. We will not make all human beings extinct as a few people with the right sort of resources may put themselves in the right parts of the world and survive. But I think it’s extremely unlikely that we wouldn’t have mass death at 4°C. If you have got a population of nine billion by 2050 and you hit 4°C, 5°C or 6°C, you might have half a billion people surviving.”22
“It is fair to say, based on many discussions with climate change colleagues, that there is a widespread view that a 4°C future is incompatible with any reasonable characterization of an organized, equitable and civilized global community. A 4°C future is also beyond what many people think we can reasonably adapt to. Besides the global society, such a future will also be devastating for many if not the majority of ecosystems.”23
Large parts of the world would be subject to extreme drought, with severe impact on food and water sup- ply and human health, whilst other parts experience intense rainfall and flooding, sometimes both in short order.24 25
An analogy with human physiology is appropriate. Normal body temperature is 37°C. Add 2°C and you have high fever. Add 4°C and you are probably dead. Just so with the climate.
In short, as the World Bank emphasizes26, if we have any sense of responsibility to current and future generations, a 4°C world is to be avoided at all costs.
